In order to use building performance results as an input into the creative design process, it’s not good enough to know how a design performs — or even how multiple design options perform —; you need to know why they are performing that way. A designer needs to understand what levers they can pull to change performance — what design elements have the biggest impact, and how they interact. This is the only way to truly integrate performance into the very DNA of a design — what I call a “performance parti.”
This is a critical step that many architects miss when trying to integrate performance analysis, and it’s one of the key lessons I try to instill in students I work with. Without understanding “why,” the numbers are meaningless.
It’s not good enough to know how a design performs — or even how multiple design options perform —; you need to know why they are performing that way.
The last post covered a concept design comparison. In this post I dive deeper into that analysis to understand what factors are driving the heating and cooling loads. For this, I used two approaches: (1) looking at the component loads (heat gains and losses) that contribute to heat and cooling; and (2) using regression analysis across the design concepts to find correlations between design elements and performance. The second approach allowed me to assess design elements like envelope area and glazing ratios that don’t directly show up in the component loads. Finally, I show a third approach that I did not use on this project, but have used on subsequent projects: (3) using sensitivity analysis (“Response Curves” in Sefaira parlance) to compare the relative impact of various strategies. This is similar to #1 except that it begins to quantify the relative magnitude of impact of actually changing the relevant variable.
Start Here: Energy End Uses
We have to start by looking at where energy is being used in each option. Which end uses are dominant? By how much? This tells us where we need to focus.
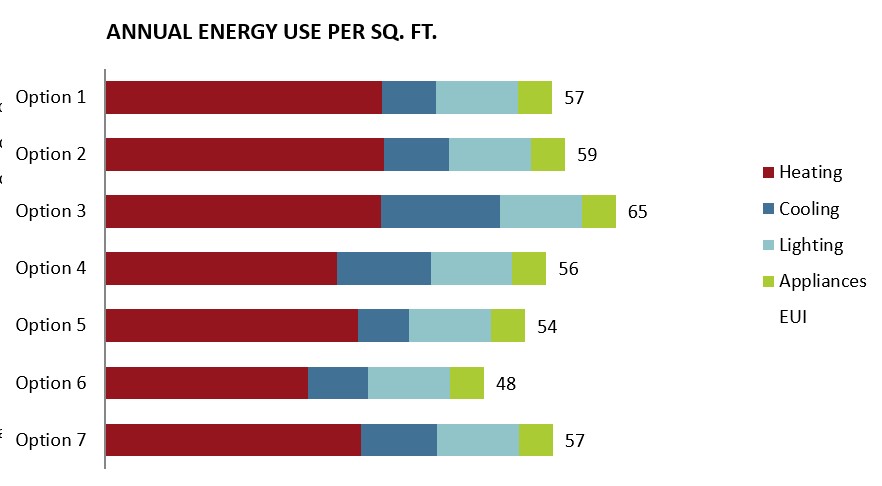
Here, starting with a code baseline envelope results in heavily heating-dominated buildings for all seven of the options studied previously — which means this is the first thing we should work to address. There is also a wide variation in cooling energy use: Option 3 is more than twice Option 5. Why is that? What should we do to improve the high-cooling designs?
Approach 1: Component Loads / Heat Balance Method
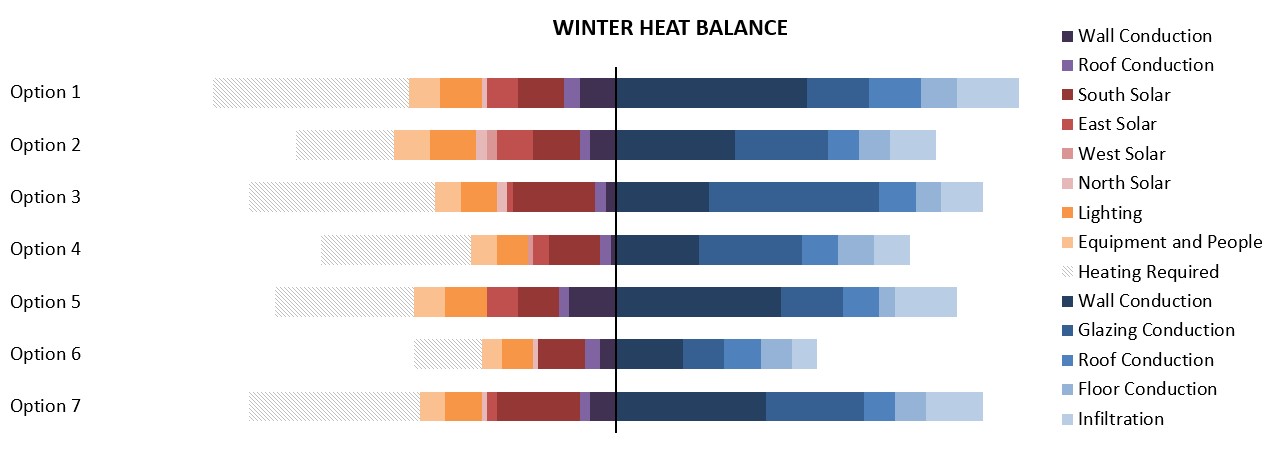
The graphs below summarizes heat losses and gains for the seven options studied previously. To understand what’s driving heating loads, we can look at the “Winter Heat Balance” diagram; and to understand what’s driving cooling loads, we can look at the “Summer Heat Balance” diagram.
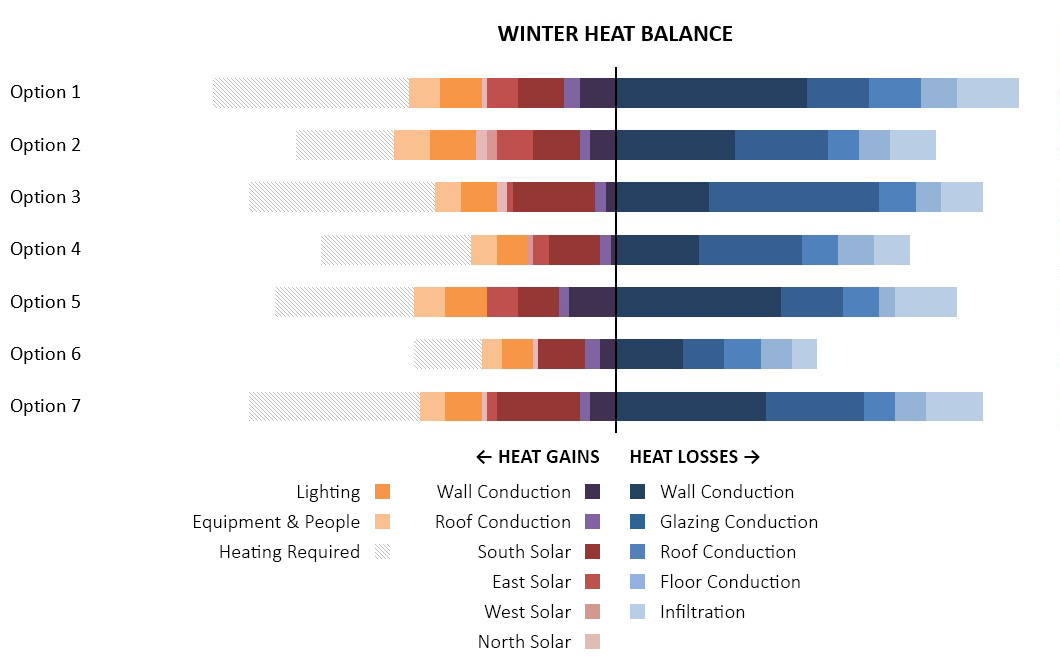
The Winter Heat Balance shows heat losses to the right and heat gains to the left. The additional heating required to balance the loads is shown as a cross-hatch. To reduce the need for active heating, we can do some combination of reducing the Heat Losses and/or increasing Heat Gains … with the proviso that we also need to pay attention to how these moves affect our Summer Heat Balance.
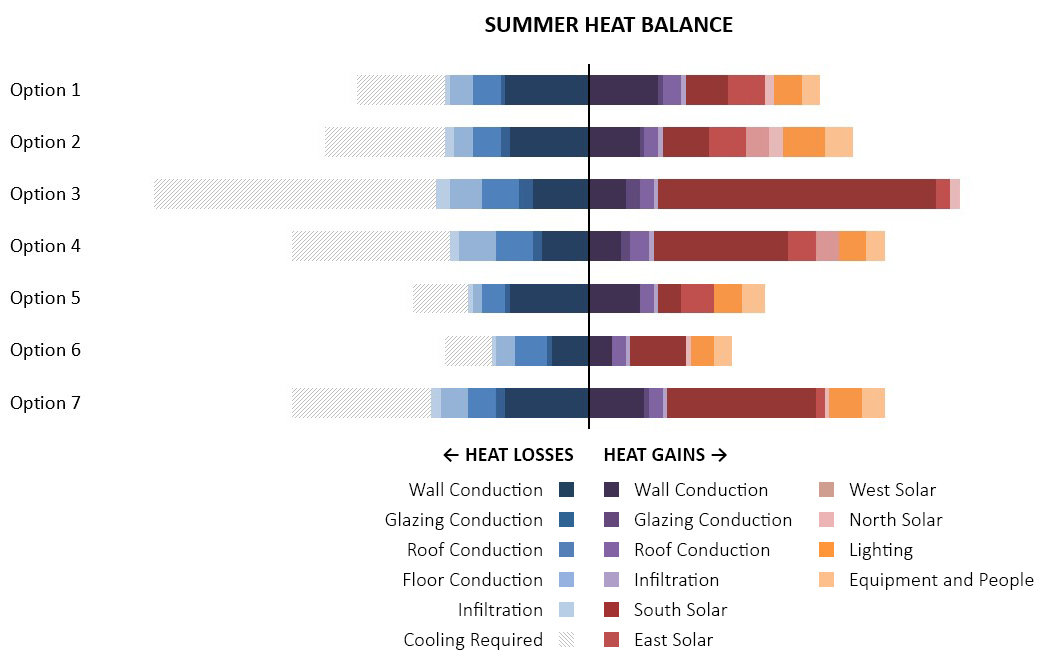
The Summer Heat Balance shows heat gains to the right and heat losses to the left. The additional cooling required to balance the loads is shown as a cross-hatch. To reduce the need for active cooling, we will focus primarily on reducing the Heat Gains. (Trying to increase Heat Losses will, on balance, hurt us more than help us. Recall from Step 1 that all of the options are heavily heating-dominated.)
Sidebar: For those attempting to replicate this analysis using Sefaira, these numbers were taken from the “Gains and Losses” chart in the plugin; the graph was made in Excel.
Let’s take a look at two of the design options to see how this analysis plays out.
Option 3
Option 3 is the highest energy user overall, and it’s pretty clear why when we look at the component loads: Both heating and cooling are driven by glazing: conduction losses drive heating, and south solar gains drive cooling. There is also, very obviously, a ton of glass in the model.
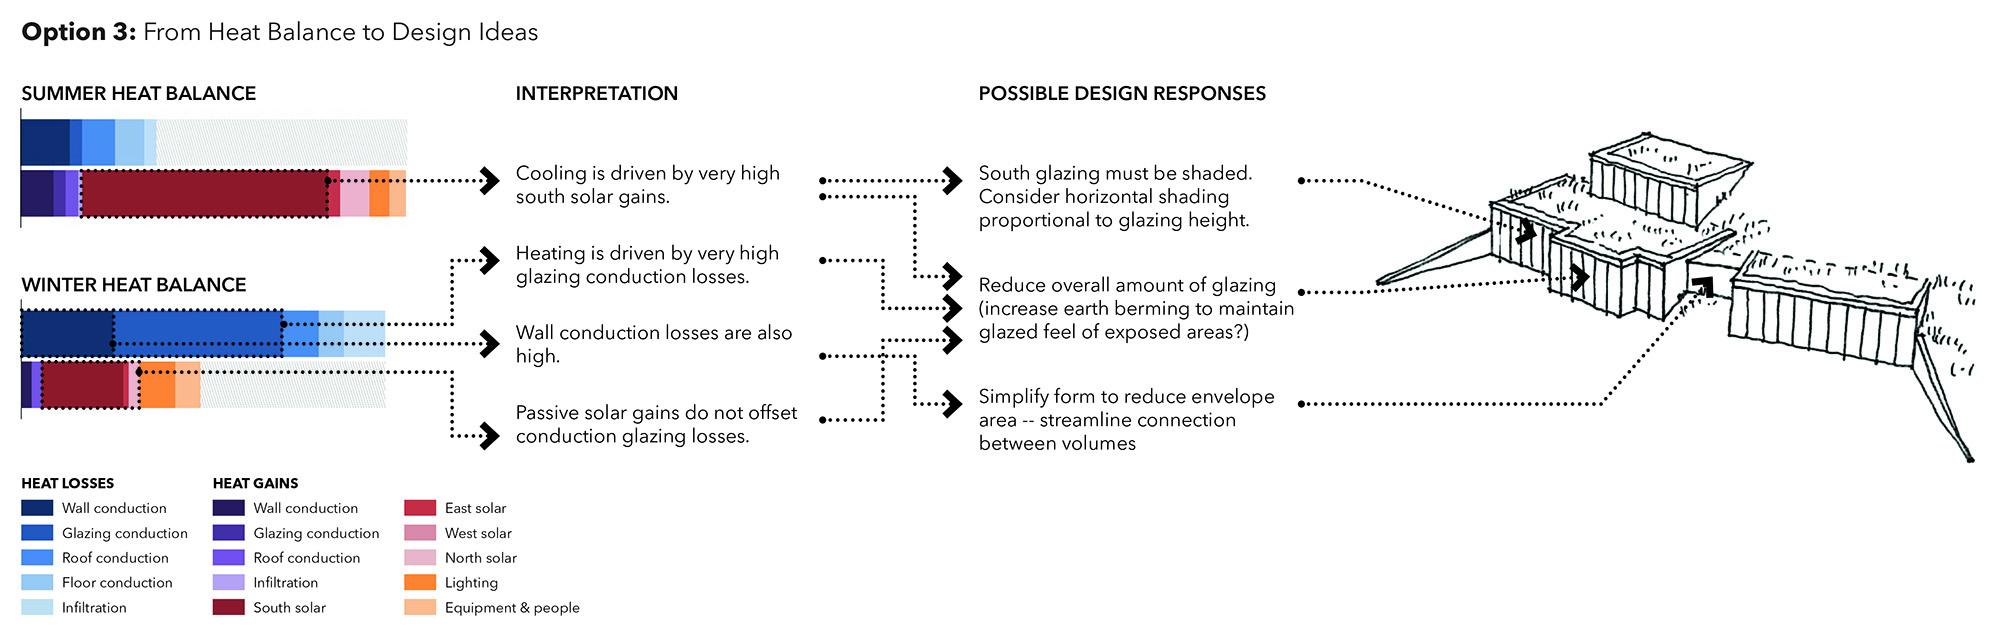
To develop this scheme further, I would look at:
- Can I reduce the amount of glazing overall? Perhaps I could explore earth-berming the facade more, so that there is less glass, but the exposed portions still read as being very glassy and open.
- It’s likely that if I want a very glassy area on the south, I will need substantial shading to avoid summertime overheating. How can this shading be made core to the design rather than a bolt-on? As a next step, I would investigate the optimum amount and type of shading for the south-facing glass. Most likely it is horizontal shading of some kind — but I could explore that quantitatively.
- I would look at making the overall form a bit more compact if possible, to reduce exposed wall area. Could the connector between the two bermed blocks be removed?
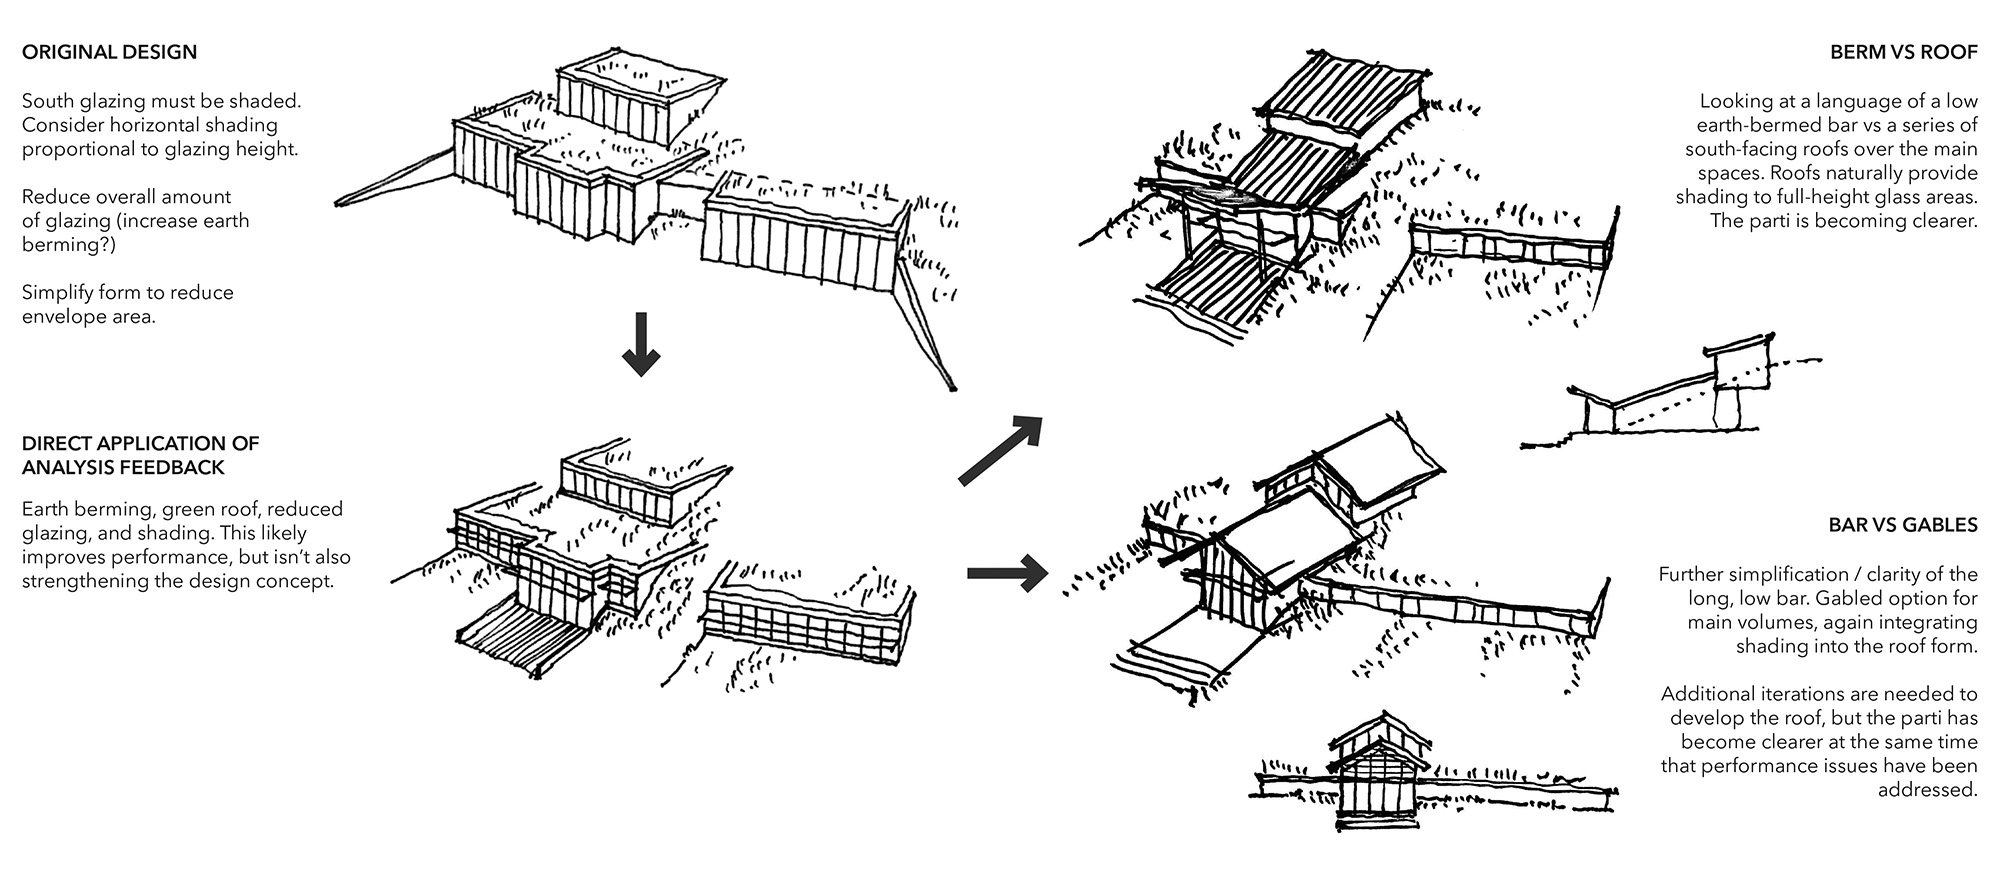
The resulting concepts are actually becoming clearer conceptually, beginning to suggest a differentiation between a glassy living area that projects from the hillside and the remainder of the house, which is becoming a more uniform earth-bermed strip. Some kind of dramatic roof over the living area could provide a deep shading element for its full-height glass (as well as, ideally, south-facing area for solar panels).
Note that these sketches are simply initial reactions; in reality, multiple iterations of design and analysis would be needed to test these hypotheses and further refine the design concept. As a next step, for example, I would want to investigate the optimum amount and type of shading for the south-facing glass to see if my “big roof” idea is actually workable, and if so, how to shape it for optimum performance. But these sketches begin to show how analysis can be used to actually shape (and improve!) the core design ideas.
Option 2
Option 2 is the second highest energy user. This comes as more of a surprise than Option 3, because at first glance it seems to be the most compact shape. So what’s happening?
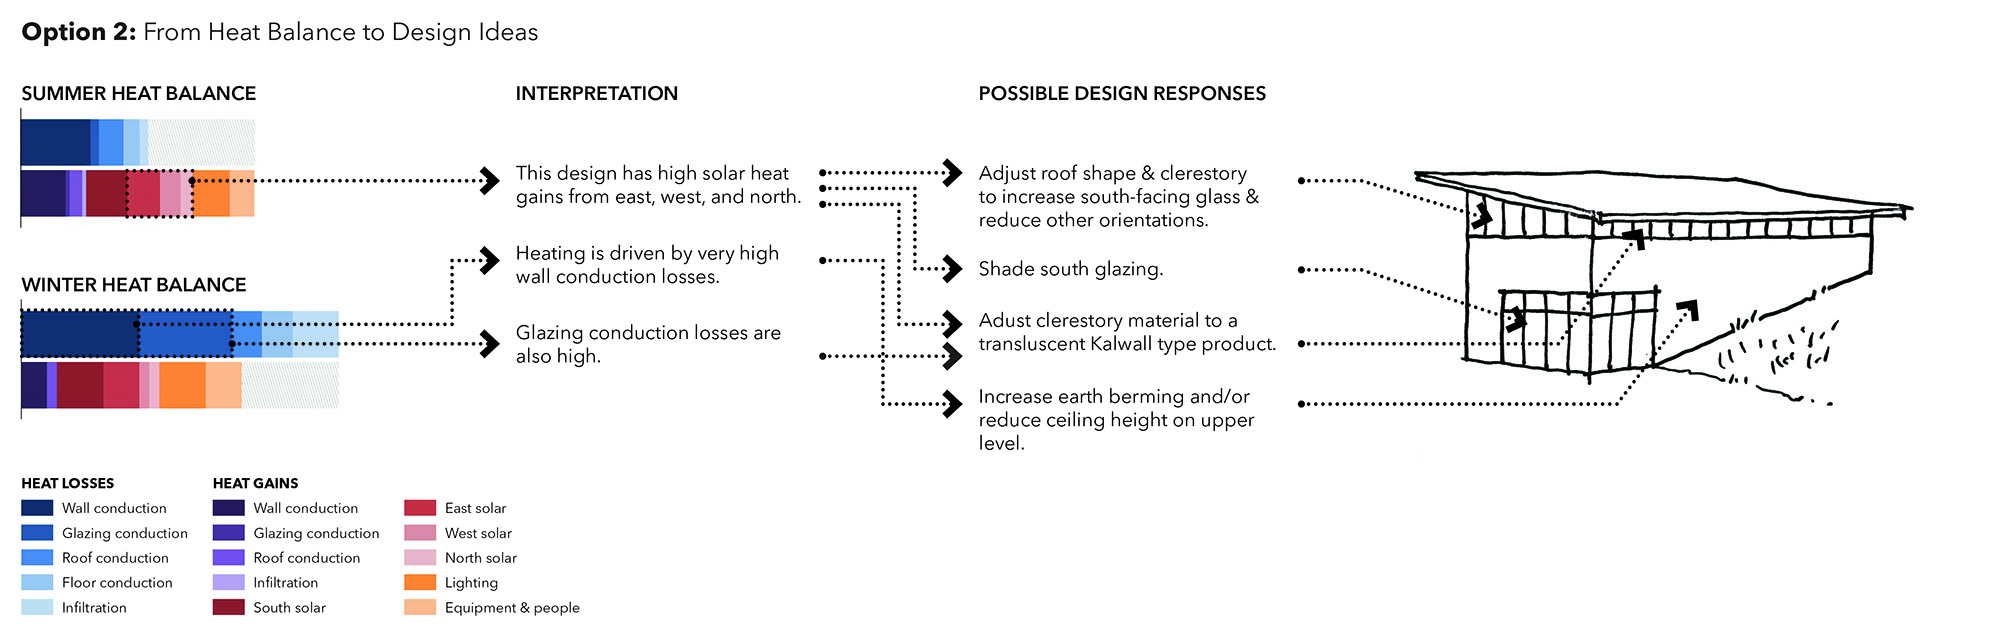
On the heating side, it has high wall conduction losses. This is likely because (1) the scheme has high floor-to-floor heights, made higher by the vaulted single-slope roof on the second floor; and (2) less of the wall is earth-bermed than in other schemes, resulting in higher heat losses through the walls. The scheme also has high glazing conduction losses. While it doesn’t “look” like this scheme has that much glass compared to the others, the continuous clerestory actually gives it one of the highest total glazing areas of the seven schemes. And a lot of this glass is not facing south — meaning it’s not contributing good heat gains to offset its losses, but instead is a pure liability from a performance standpoint.
On the cooling side, we’re getting more solar gain from East, West, and North windows than many of the other schemes — again because of the continuous clerestory — and especially because the taller part of the clerestory is facing West / Northwest, which is one of the worst orientations from a cooling perspective. And because of the angled floorplan, the “south” glazing at the corner is not truly south, and so is also picking up gains from the east and west. Finally, we also have high wall conduction gains for the same reasons we have high wall conduction losses.
So, what would I consider if we pursued this scheme further?
- Could I increase the portion of the wall that’s earth-bermed in this scheme? Perhaps by sinking it deeper into the hillside?
- Can I reduce the amount of glazing in the clerestory (while still providing sufficient daylight)? Especially glazing toward the North and West. OR, if I truly want the look of the continuous glass, could I use something like Kalwall with a high R-value? That might really add to the “beacon” concept by providing a translucent glow at night.
- In a similar vein, I might consider flipping the slope of the roof in order to get more of the glazing facing south and east. Or I could reduce the roof slope, or look at a different room form entirely that keeps the clerestory from getting quite so tall.
- What if I could make the south-facing glass truly south-facing — perhaps by cutting an angle into the volume?
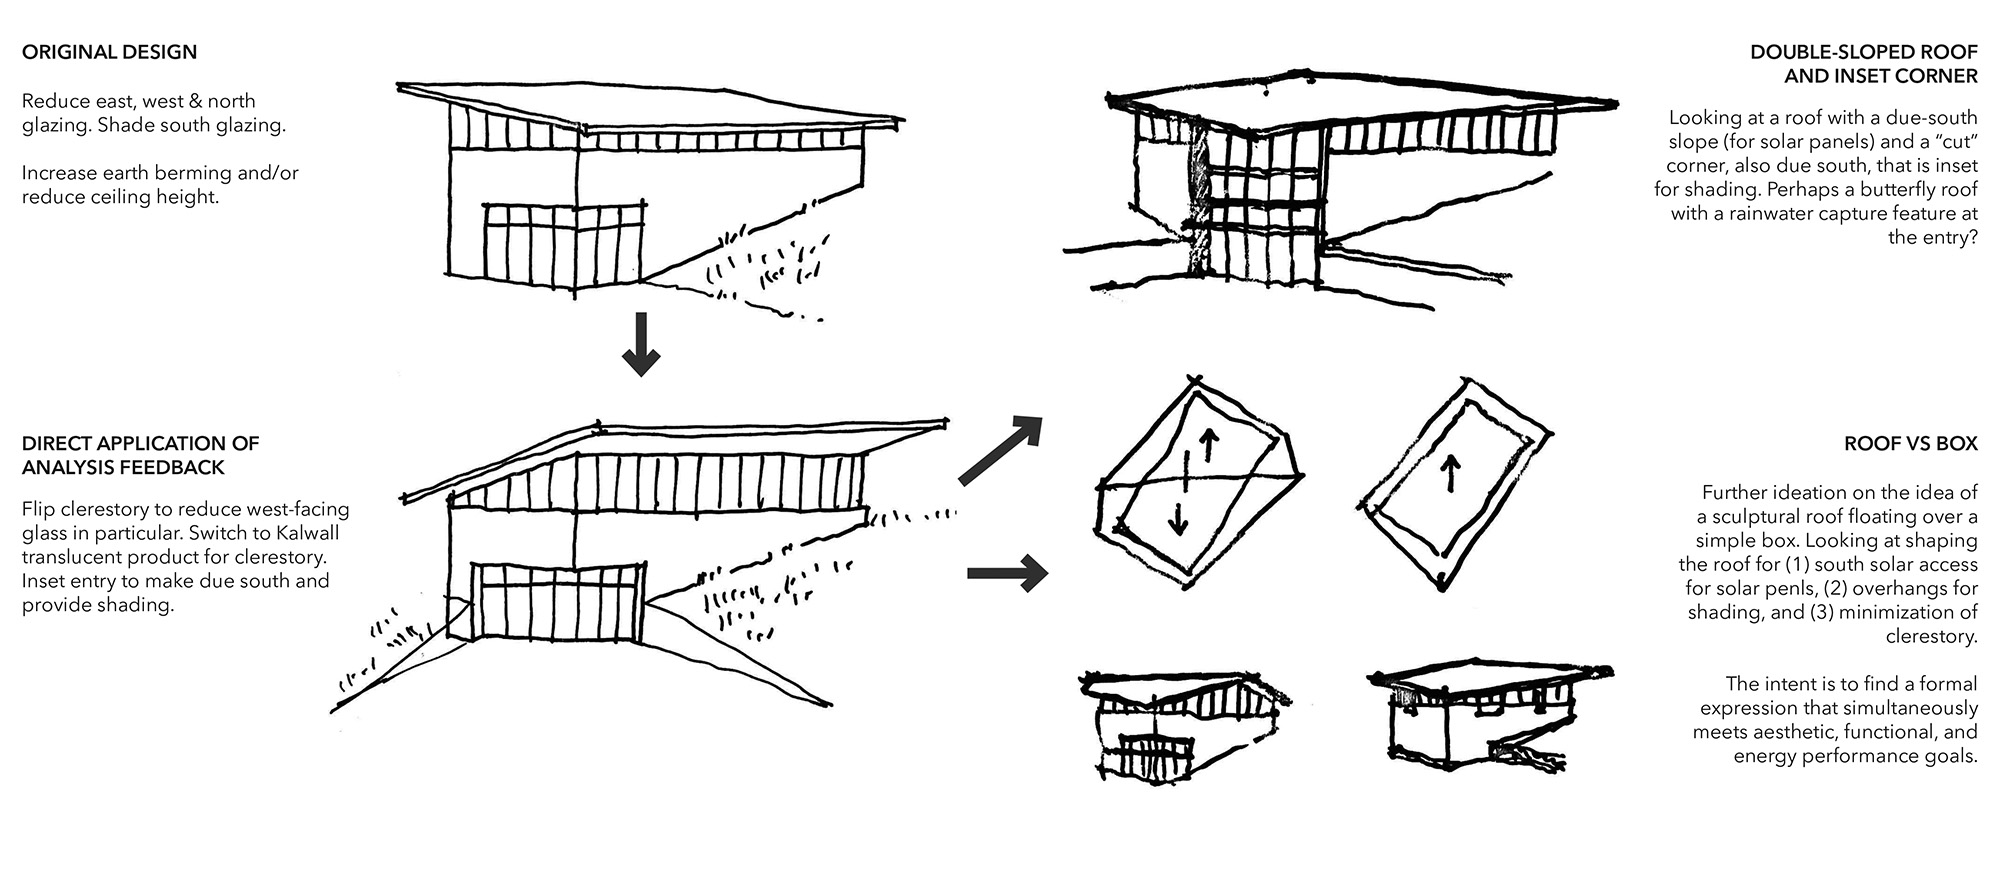
Again, the sketches are beginning to clarify the concept: a sculptural roof form floating above a glowing translucent clerestory.
Obviously there are other strategies that would help all or many of these designs: super-insulation would dramatically reduce wall and roof conduction losses; and excellent windows would likewise reduce glazing conduction losses. But at this stage of design, I’m more interested in the moves that impact the form, facade, and design concept. As the notes above demonstrate, the performance data, if properly interrogated, can provide fertile ground for growing a design idea, and rooting it firmly in place.
Performance data, if properly interrogated, can provide fertile ground for growing a design idea, and rooting it firmly in place.
The sketches above are not intended as definitive, or the only possible approaches. Instead, they are intended to be suggestive of the dialogue that should exist between energy modeling and design concepts — a dialogue that enables both to develop simultaneously, and end up stronger because of it. As I mentioned in my previous post, the intent is to end up with a design concept that is also a performance concept; the two should be inextricable. And if we’re successful, we’re set up for a clarity of intention and expression that is fundamental to good design.
Approach 2: Regression Analysis
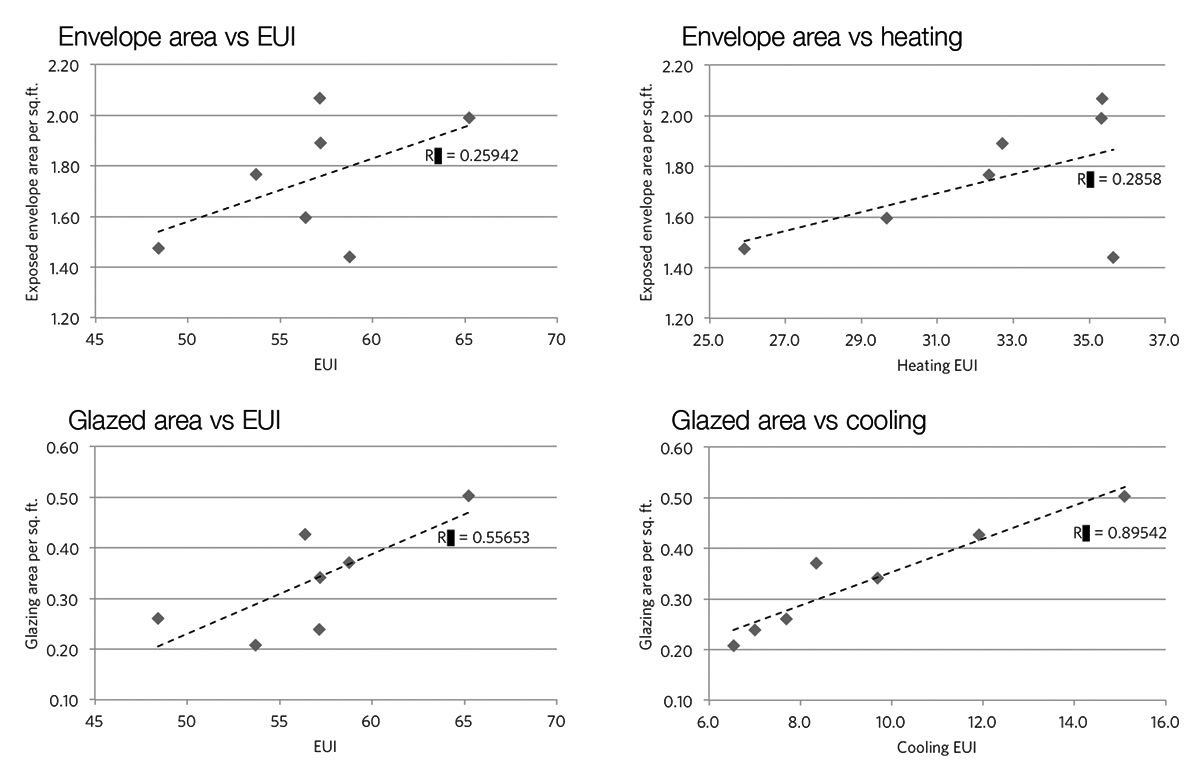
As an alternate method for interrogating design decisions, I used regression analysis to see whether there were strong correlations between heating loads, cooling loads, and/or total energy use and several key variables like envelope area and glazing ratios. My hope was that this approach would allow me to see the impacts of design decisions that can sometimes be less visible by looking only at the heat balance. The impact of surface area to volume ratio, for example, is difficult to see by looking at heat balance alone.
The results of the regression analysis are below. Each dot on the graph is one of the design options.
Some observations from the analysis:
- There was a reasonably strong correlation between glazed area and cooling. This is somewhat obvious since shading was not modeled.
- There was a less strong but still noticeable correlation between glazed area and EUI.
- Envelope area per sq. ft. also showed a strong correlation with heating energy use (if one outlier concept is ignored). That’s a strong argument for compactness and formal simplicity.
Ultimately, I found this analysis to be less useful than the Heat Balance method, and have not utilized it subsequently, for several reasons:
- The sample size of design options is too small to draw meaningful conclusions from the data.
- The performance of a design is never uni-causal. Multiple factors interact, and they interact differently for each design — so trying to draw conclusions for one variable like glazing ratios from multiple very different designs turns out to be a poor fit. The outliers almost always have an explanation that is more apparent from the Heat Balance method — e.g. “this one was worse because most of the glass did not face south.”
- There are too many combinations of variables to study. For example, I suspect that “glazed area vs heating” may have been meaningful, but was not one of the ones I chose. Even “glazing area” is probably too general, and should be divided by orientation, further increasing the number of permutations.
- Most importantly: the analysis failed to provide any useful insight that wasn’t provided equally well or better by the Heat Balance or Response Curve approaches.
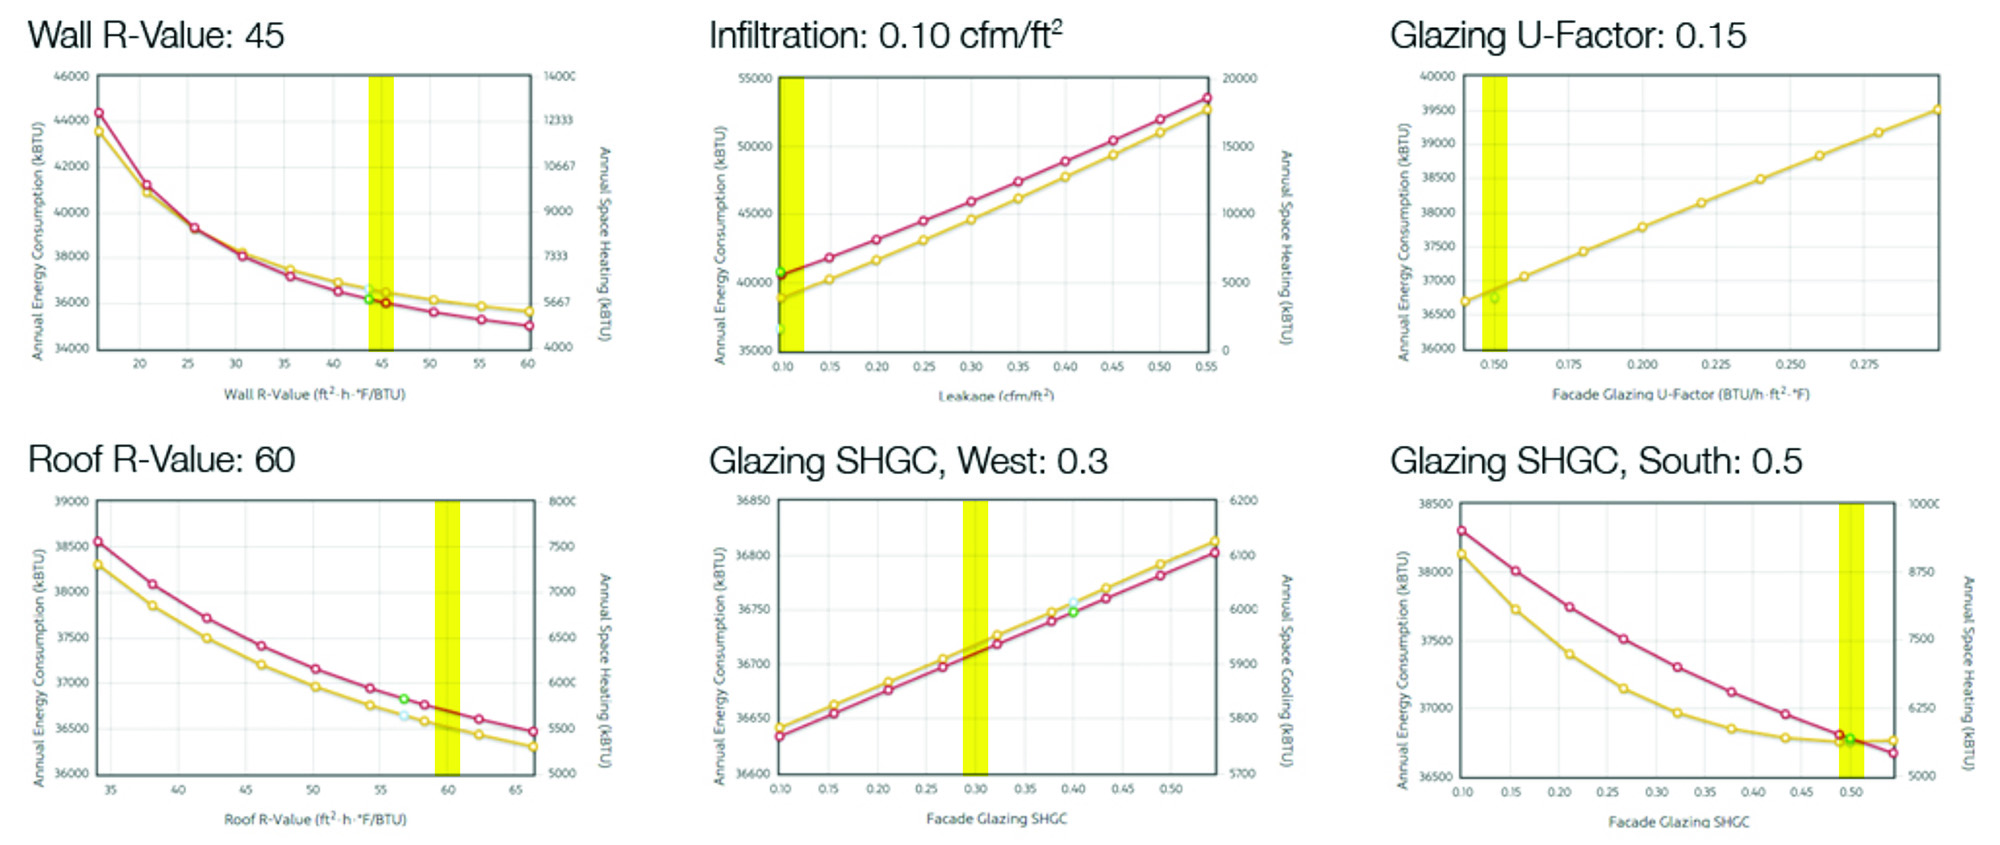
Approach 3: Response Curves
“Response Curves” are a feature in Sefaira that allow a user to perform sensitivity analysis — to see performance of a single variable across a range of values. For example, the response curve below labeled “Glazing SHGC, South” shows how changing the Solar Heat Gain Coefficient on the south-facing windows effects total energy use (in yellow) and annual heating load (in red). This curve shows an inflection point around SHGC-0.5; other curves (for instance, the “Wall R-value”) show diminishing returns — beyond a certain value, benefits begin to diminish.
By creating response curves for multiple elements, and plotting them on the same axis, you can see the relative magnitude of impact for each element. The image below is from a different project (the Moothart Residence, by Sol design + consulting), and looks at total energy use rather than the total heating or cooling load, but provides an example of what this type of analysis can look like.
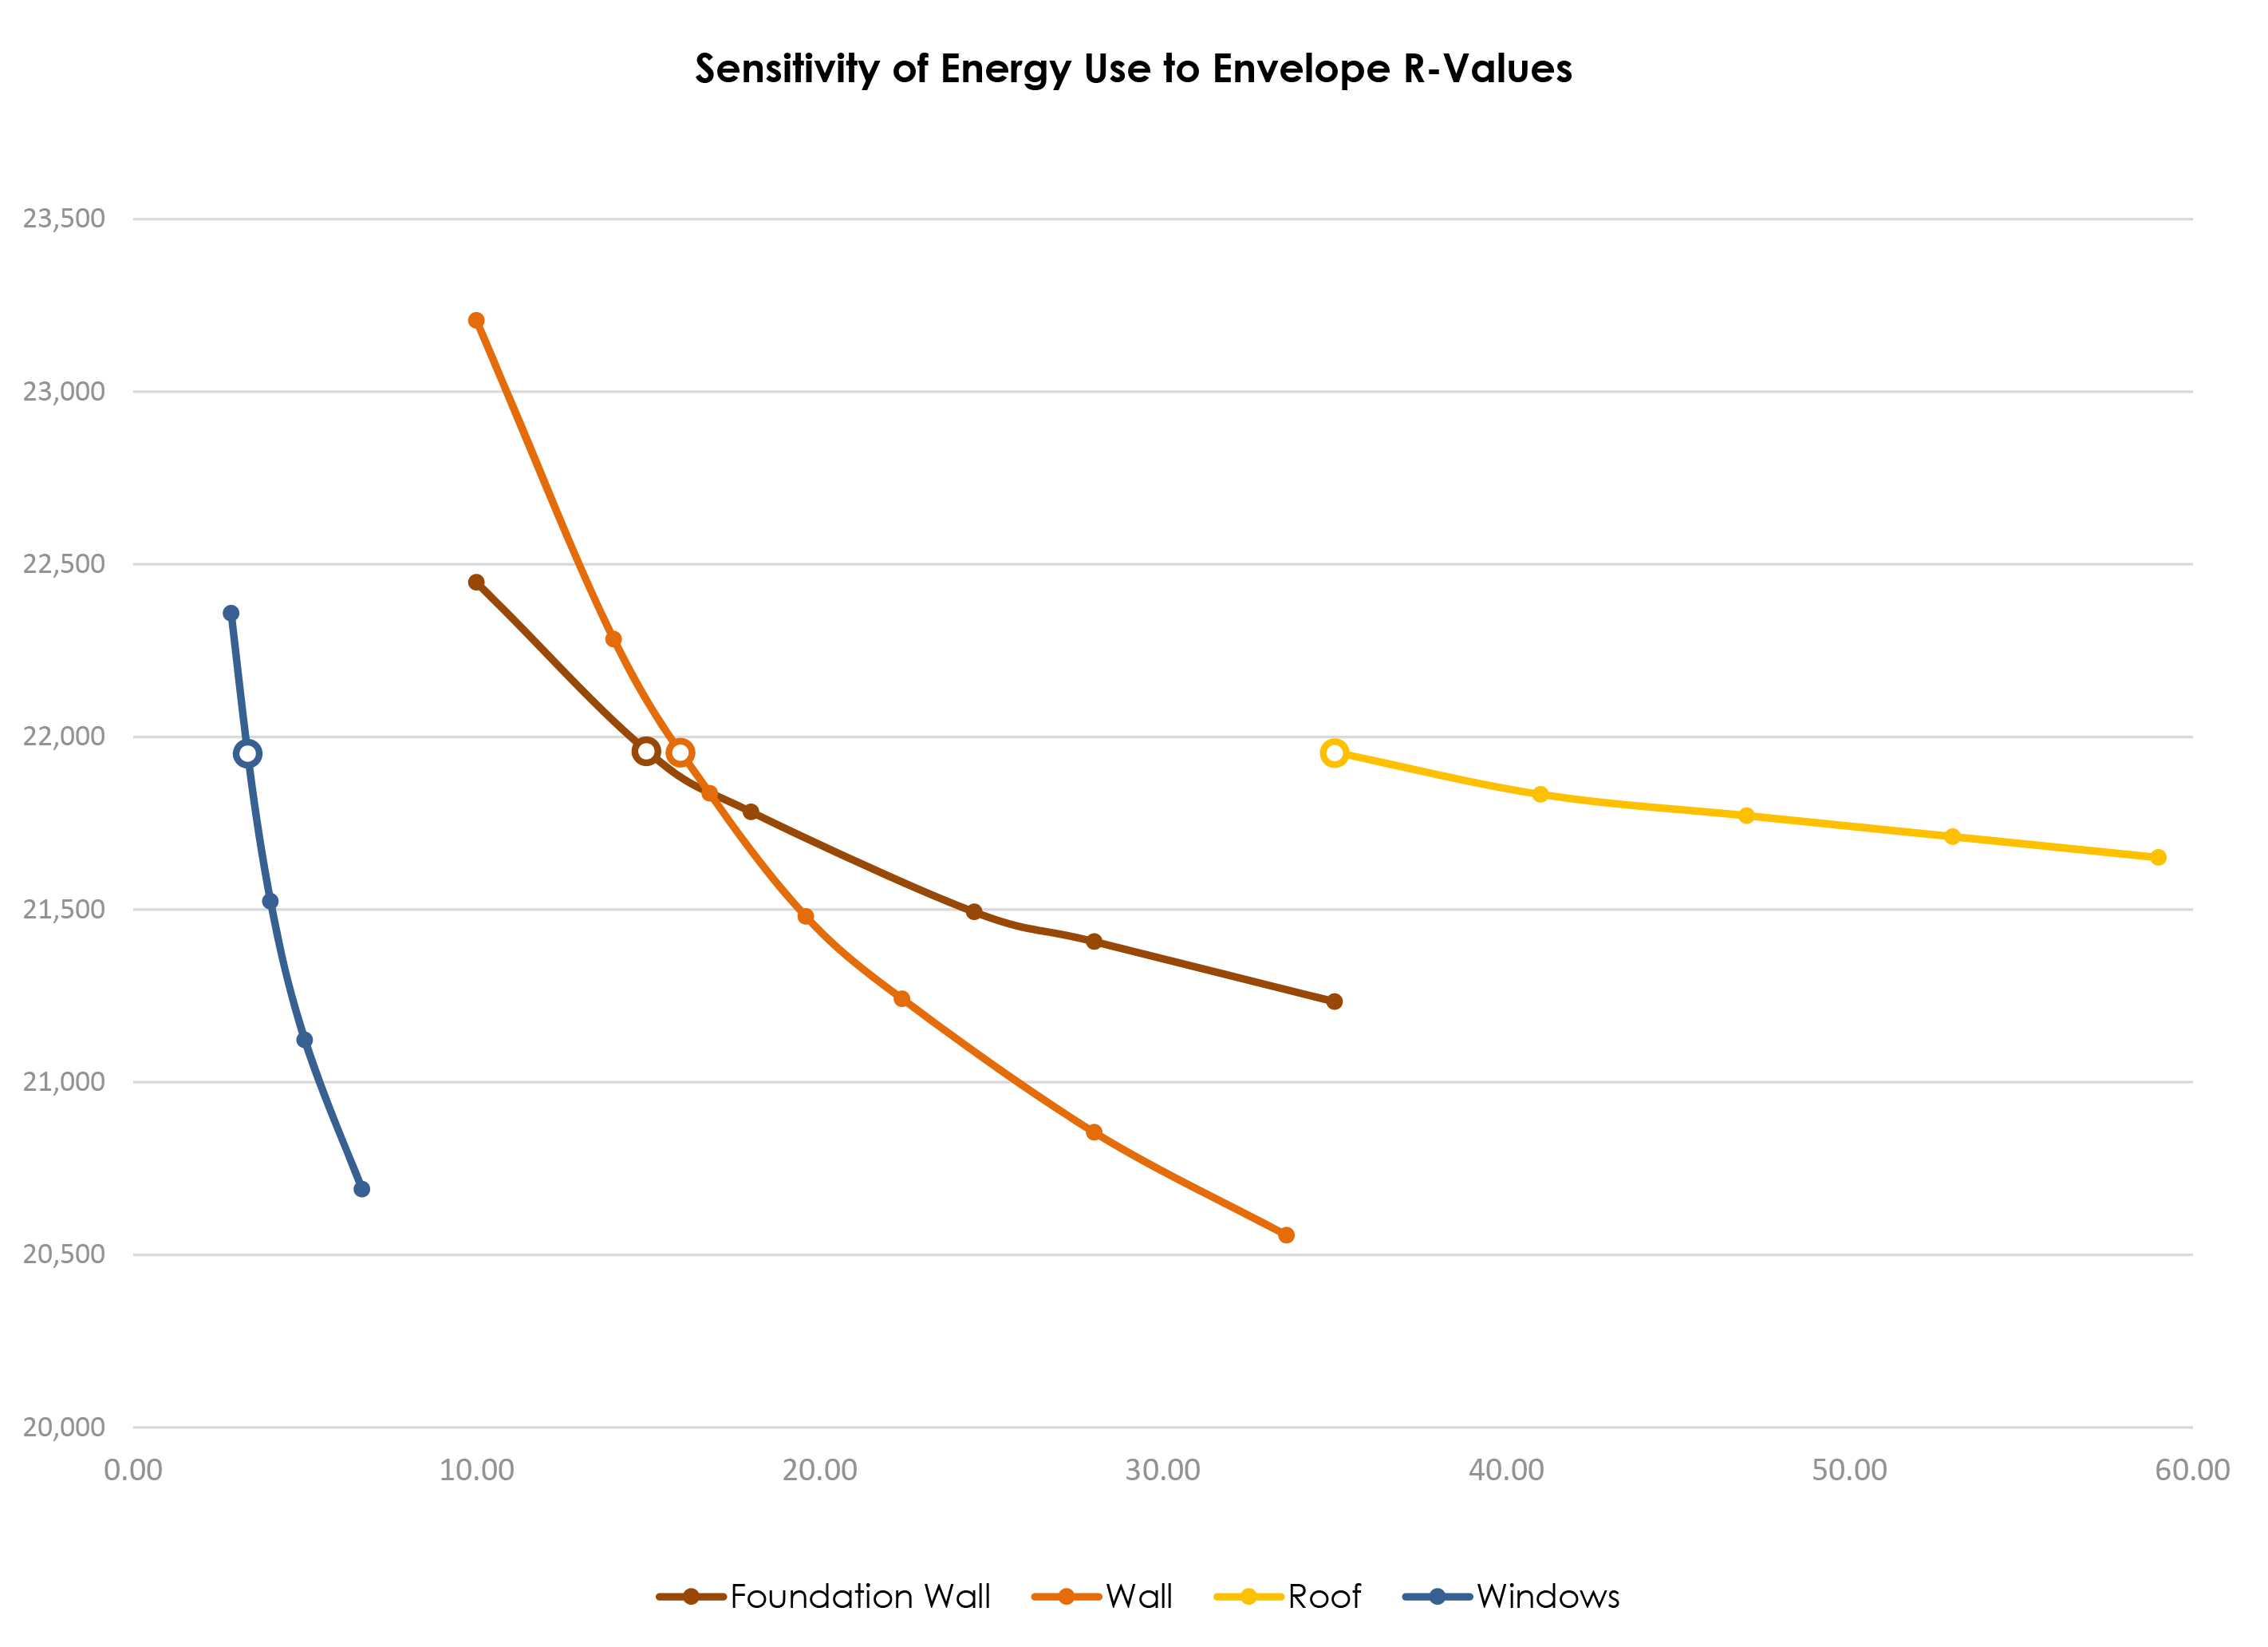
Here, I can see that there is still a lot of value in pursuing higher wall R-values and window U-values, because these curves drop off steeply. There is far less marginal benefit in increasing roof R-values from their current design.
This analysis is similar to the sensitivity analysis I conducted at the beginning of the project, except that now it’s applied to a specific design and can inform next steps. And, while the analysis above focuses on envelope R-values, at the concept stage I would be conducting it primarily for elements like glazing ratios, building orientation, and shading, with a focus on heating & cooling loads as the outputs. Also note that the intent is NOT to optimize the variables at this point, because the optimum depends on all of the other variables. Rather, we’re trying to understand which elements have the biggest impact — what levers we as designers can pull. Homing in on the optimum is an iterative process; at this stage, we need to get the big moves right.
(For those interested in step-by-step guidance on recreating this type of analysis, see my earlier post on using Response Curves for sensitivity analysis.)
Lessons Learned
A few points here:
- Start with a Passive House envelope, rather than code minimum. This would have (1) made the impact of aspects like form even more evident; (2) made internal loads a much larger portion of the energy pie, bringing necessary focus to these elements earlier in the design process; and (3) provided a more realistic picture of the impacts of shading and glazing ratios, whose optima depends heavily on how well insulated the envelope is. (I’ve written more on this here.) I already knew from previous analyses that an insulated, air-tight envelope was important, and should have represented at least a rough approximation of that here.
- Look at peak loads and/or thermal comfort. Peaks don’t always track overall loads — in other words, your total cooling load may be acceptable, but there could still be an overheating problem for a portion of the year or in a particular room. (This came back to bite me later.) (More on this in future posts.)
- Regression analysis is not necessary, and I have not done it on subsequent projects. If I want to isolate the impact of building form, I could simply make the other inputs, including glazing ratios, the same across all options (which is easy to do in Sefaira). And to isolate the impact of glazing ratios, I could use Response Curves.
- Heat balance analysis is powerful, and I use it on every design project. I have found it to be the essential starting point for truly informing design.
Many of these are similar to the lessons from the prior post — and for good reason. They are the preconditions for making this early analysis accurate and actionable — which are themselves preconditions for analysis that can inspire and shape a design.